Do prompt embeddings improve demand forecasts?
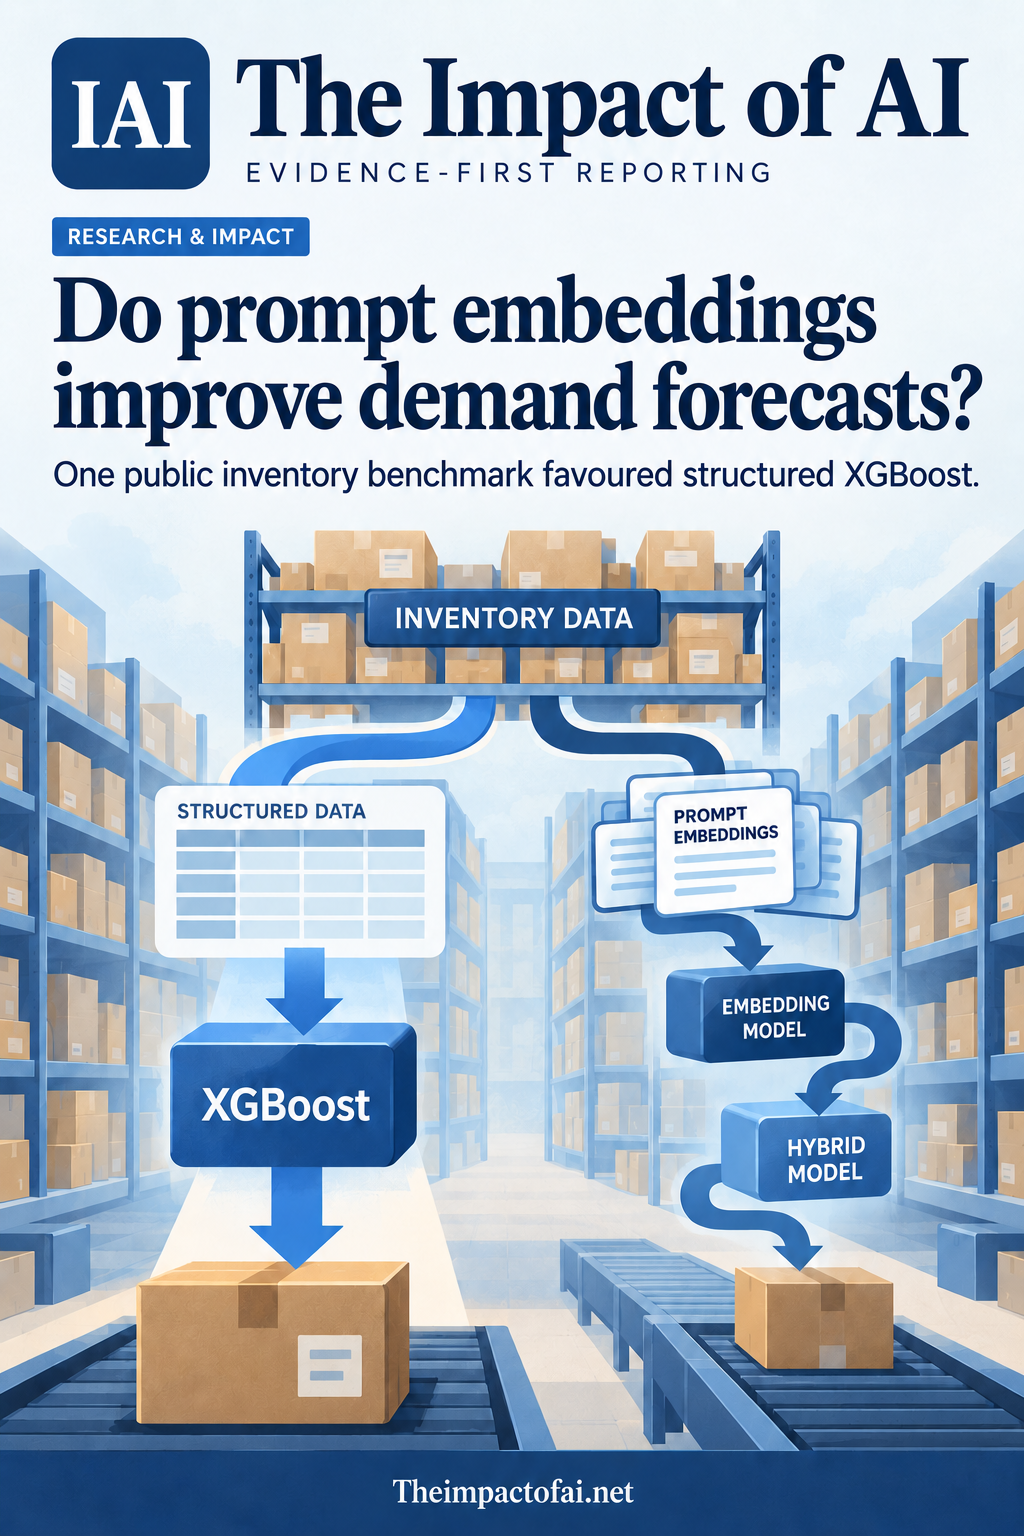
Not in the strongest result from one peer-reviewed inventory benchmark. Structured XGBoost beat its prompt-embedding hybrid on 14,700 held-out records, while the hybrid helped only the weaker Random Forest family.
Editorial responsibility: The Impact of AI Editorial Desk · Report a factual concern
At a glance
- 1The study used 76,000 public records spanning 760 daily timestamps, five stores and 20 products; after lag construction, the final chronological test contained 14,700 records.
- 2Tabular XGBoost was the strongest tuned holdout model, with MAE 11.4174, RMSE 16.3032, WAPE 11.4220% and R² 0.8638.
- 3Adding 32 prompt-embedding components worsened holdout RMSE for XGBoost by 9.10% and LightGBM by 1.19%, but improved Random Forest by 2.58%; the dataset's original business provenance was not independently verified.
Research topic
Whether sentence embeddings made from structured inventory prompts add forecasting value beyond strong tabular machine-learning models
No: the strongest structured model beat the prompt-embedding hybrid
The clearest result is that adding a language-style representation did not improve the best demand forecast. In a peer-reviewed benchmark published on 5 October, tabular XGBoost achieved the lowest error on the final chronological holdout. Its hybrid counterpart received the same engineered business variables plus prompt-derived sentence embeddings, yet its root-mean-square error was 9.10% higher. A tabular LightGBM model also beat its hybrid version. Only the weaker Random Forest family improved when embeddings were added.
That negative result is useful. It challenges a common assumption that converting structured records into prose and embedding the prose automatically adds intelligence. Here, the prompt restated information already available as columns: store, product, date, season, weather, price, promotion, inventory and recent demand. Strong tree models could already exploit those variables directly. The study therefore identifies a boundary condition rather than declaring prompt engineering useless: embeddings may add little when they mainly repackage an already informative table.[1]
The Impact Brief · Free
Follow the evidence in finance & business.
Get a five-minute weekday briefing on what changed, why it matters and where the evidence comes from. Choose the topics you care about.
The test used 76,000 public records, but their business provenance is uncertain
The starting dataset contained 76,000 observations across 760 daily timestamps, five stores and 20 products. It was downloaded from a public Kaggle listing uploaded by Ramin Huseyn. The paper reports 16 original variables, including product category, region, weather, seasonality, price, discount, competitor price, promotion, epidemic status and inventory level. After lag and rolling features were constructed, 73,200 observations remained because early dates lacked sufficient history.
Those denominators are substantial for a model benchmark, but they do not establish that the records came from an audited retailer or that the variable relationships resemble a live supply chain. The authors explicitly say the original organisational provenance could not be independently verified and describe the findings as dataset-specific and exploratory. That caveat limits commercial claims: the benchmark can compare representations under one controlled pipeline, but it cannot show that the winning model would improve replenishment at a real store.[1]
The comparison kept the model families constant
Researchers evaluated LightGBM, XGBoost and Random Forest in two forms. The tabular version used engineered structured features. The hybrid version added a text representation made by turning each store-product-date row into a standardised natural-language prompt. The prompt was encoded with the all-MiniLM-L6-v2 sentence-transformer, producing 384 dimensions. Principal-component analysis, fitted on training embeddings only, reduced that representation to 32 components that retained 96.7159% of training-embedding variance.
This was not a generative language model forecasting future demand in natural language. The language component served as a fixed representation layer, and the tree-based algorithms still produced the predictions. Separate modest hyperparameter searches were run for every tabular and hybrid variant on the same validation period. That within-family design makes the central question reasonably clean: did the extra embedding representation help the same class of learner after tuning? It also means the result should not be stretched into a general comparison between large language models and all conventional forecasting methods.[1]
The final holdout respected time order
The usable modelling window ran from 29 January 2022 to 30 January 2024. The first 80% of unique dates were reserved for training and validation; the last 20% formed the final test. Within the earlier period, 49,700 rows were used for tuning-stage fitting and 8,800 rows from 10 June to 5 September 2023 formed the validation slice. The locked holdout covered 6 September 2023 to 30 January 2024 and contained 14,700 observations.
Chronological separation is preferable to a random row split because a forecaster should learn from the past and predict the future. The paper also says imputation, clipping, encoding and embedding reduction were fitted without the final test period, while lagged demand variables used a shift-first procedure. But the holdout contained only autumn and winter dates. It cannot establish four-season performance, resilience to new stores or products, or behaviour after a major regime shift that differs from patterns in the public dataset.[1]
The winning numbers are precise, but their scope is narrow
On the final holdout, tabular XGBoost reported mean absolute error of 11.4174 units, root-mean-square error of 16.3032, mean absolute percentage error of 17.8859%, weighted absolute percentage error of 11.4220% and R² of 0.8638. The hybrid XGBoost ranked second, but adding embeddings increased RMSE by 9.10% relative to the tabular version. The hybrid layer increased LightGBM RMSE by 1.19% and reduced Random Forest RMSE by 2.58%.
The authors supplemented the holdout with paired bootstrap intervals and Diebold-Mariano tests. They also repeated model fitting with three random seeds and ran four expanding-window temporal checks. Those analyses support the reported ranking inside the study, but they are not a complete independent backtest: the seed exercise varied model-fitting stochasticity while keeping the representation and selected settings fixed, and the rolling-origin runs reused the validation-selected configurations rather than retuning inside each window.[1]
For businesses, the practical lesson is to price the extra complexity
A retailer considering prompt embeddings should ask what new information the text layer contributes. If the prompt simply rewrites the same price, promotion and stock columns, the pipeline adds embedding computation, dimensionality reduction, monitoring and more opportunities for failure without necessarily adding signal. A strong tabular baseline, time-ordered evaluation and segment-level error analysis should come first. The new component should earn its operational cost by improving outcomes that matter, not by sounding more advanced.
There are plausible settings where text could help: manager notes, campaign descriptions, local event reports, product reviews or supplier messages may contain information absent from the table. This paper did not test that case. It embedded variables the model already had. Businesses should therefore treat the result as a warning against redundant representation, not as evidence that unstructured operational text is useless. A controlled test should compare the same frozen decision workflow with and without genuinely additional text.[1]
The inventory simulation was illustrative, not a deployment trial
To connect forecast error with operations, the researchers passed daily predictions into a simplified continuous-review inventory simulation with a fixed seven-day replenishment lead time. Orders were based on forecast demand, current inventory position and a safety-stock term derived from recent demand volatility. XGBoost variants produced the best fill rates and stockout-period rates, but the differences were small and the authors explicitly frame the exercise as an illustration rather than an optimised policy or cost comparison.
A real deployment would need supplier lead-time distributions, service targets, minimum order quantities, spoilage, substitutions, lost-sales assumptions, holding costs, shortages and human overrides. It would also need to measure whether forecast improvements survive when orders change future demand and inventory availability. The simulation shows how predictions can flow into service metrics; it does not show that a company would save money or reduce stockouts by adopting the published model.[1]
What would change the assessment
Confidence would increase with independent replication on audited datasets from multiple retailers, product types and regions. Tests should hold out whole stores and products, span complete seasonal cycles and include disruptive periods. A pre-registered comparison could separate three cases: strong structured data alone, the same data rewritten as prompts, and structured data augmented with genuinely new free text. Compute time, inference latency, maintenance burden and calibration should be reported beside forecast error.
The decisive evidence would be a prospective trial in which forecasts support real replenishment decisions under a locked evaluation plan. Outcomes should include service level, waste, working capital, missed sales and staff intervention, with uncertainty across sites and time. Until then, the paper supports a disciplined conclusion: on one public multi-store dataset, prompt-derived embeddings did not improve the strongest forecasting model, and extra representation complexity should not be mistaken for extra predictive value.[1]
What this means for people
- Operations teams should demand evidence that a more complex AI layer improves decisions, not only benchmark scores.
- More accurate forecasts could reduce empty shelves and excess stock, but this study did not measure those outcomes in a real business.
- Staff remain responsible for exceptions, supplier constraints and local knowledge that are absent from the public dataset.
Global context
The authors are affiliated with four universities in the United States, but the benchmark uses a public Kaggle dataset whose original organisational and geographic provenance could not be independently verified. Retail demand patterns, promotions, supply lead times and service expectations vary widely by country and business. The result is best read as a representation benchmark with global methodological relevance, not evidence about any specific national retail market.
What the evidence does not yet show
- The benchmark used one public Kaggle dataset whose original organisational provenance could not be independently verified.
- The prompt embeddings mostly restated variables already present in the structured feature matrix rather than adding independent text.
- The final holdout covered autumn and winter only and did not test unseen stores, products or organisations.
- The three-seed check measured model-fitting stochasticity, not full tuning or embedding uncertainty.
- The rolling-origin checks reused validation-selected settings and were not fully nested backtests.
- The inventory exercise used simplified assumptions and did not measure real costs, human decisions or a deployed supply chain.
What to watch next
- Independent replication on audited retailer data across stores, products, seasons and regions.
- Comparisons where embeddings add genuinely new unstructured information rather than rewriting existing columns.
- Prospective evaluation of service levels, stockouts, waste, working capital and staff intervention.
- Compute, latency, calibration and maintenance costs reported alongside accuracy.
- Group-held-out tests for new products, stores and disruptive demand regimes.
Living evidence record
Impact record IAI-0DXXADF
Evidence stage
Studied
Confidence
Supported
Reporting basis
Source analysis
Independent or research support
Present
Record status
Monitoring
Last checked
5 October 2026
Source trail
1 direct source across 1 source type.
People impact
Documented in this record.
Uncertainty
Limits and next checks are explicit.
Stages describe the evidence available—not whether a technology is good or bad. See the public method.
Single-source reporting disclosure
This record analyses one direct source. It can establish what Discover Analytics published or reported, but it is not independent corroboration of every performance claim or predicted outcome. The confidence label will change only when broader evidence is added.
Evidence trail
Sources used for this report
Links checked 5 October 2026
This report is labelled source analysis. We summarise and analyse source material in our own words; company statements remain attributed claims until independently supported. Translated summaries preserve the meaning of the original source and link back to it. Read our editorial standards.
Continue the story
Related reporting
Finance & Business
Do retailers need deep learning to forecast demand?
Not in this benchmark. XGBoost matched or beat five linear and neural-network alternatives on 913,000 historical sales records, while training faster than every neural model. The study does not prove the same choice will work in a live retailer.
9 min · 3 sources
Finance & Business
Is AI financing becoming circular?
A Bank for International Settlements analysis maps 1,246 AI firms and 972 investment relationships, finding that commercial links accompanied 16.1% of AI-to-AI deals by count but 46.4% by disclosed value. The pattern is consequential, yet it does not show that the transactions were improper, unprofitable or certain to spread financial stress.
10 min · 5 sources
Finance & Business
Who is financing AI's power backbone?
General Catalyst, Koch Equity Development and co-investors have agreed to put $2 billion of preferred equity into Axiom at a $37.5 billion enterprise value. The capital is expensive, the separation is unfinished and the disclosed terms do not prove AI demand will deliver the promised returns.
8 min · 2 sources
Reader commentary
Add evidence, experience or a question
No account is required. Reader notes are published after a brief civility, relevance and safety check; disagreement is welcome.
Explore commentary across the portal →Published reader notes
0No published reader notes yet. You can start the evidence-led discussion above.
Prefer a private correction or response? Contact the newsroom.