Will AI make warm East Asian winters more predictable?
A Korean-led study trained convolutional networks on a 100-member climate-model ensemble and found higher simulated skill for extreme warm East Asian winters under a high-emissions future scenario, while cold-extreme skill stayed modest. The result is a perfect-model experiment, not an operational forecast guarantee.
Editorial responsibility: The Impact of AI Editorial Desk · Report a factual concern
At a glance
- 1The authors used 100 CESM2 large-ensemble members, training on 90 and reserving five each for validation and testing across 50-year historical and future periods.
- 2Median correlation for mean winter temperature rose from about 0.38 historically to 0.44 in SSP3-7.0; top-five-percent warm-extreme skill approached 0.3, while cold-extreme skill remained below about 0.2.
- 3The comparison is a perfect-model experiment within CESM2-LENS. Integrated-gradients patterns suggest greater future sensitivity to tropical Pacific sea-surface temperature, but attribution is not proof of a causal forecasting mechanism.
Research topic
How the simulated seasonal predictability of East Asian warm and cold winter extremes changes under a warmer SSP3-7.0 climate
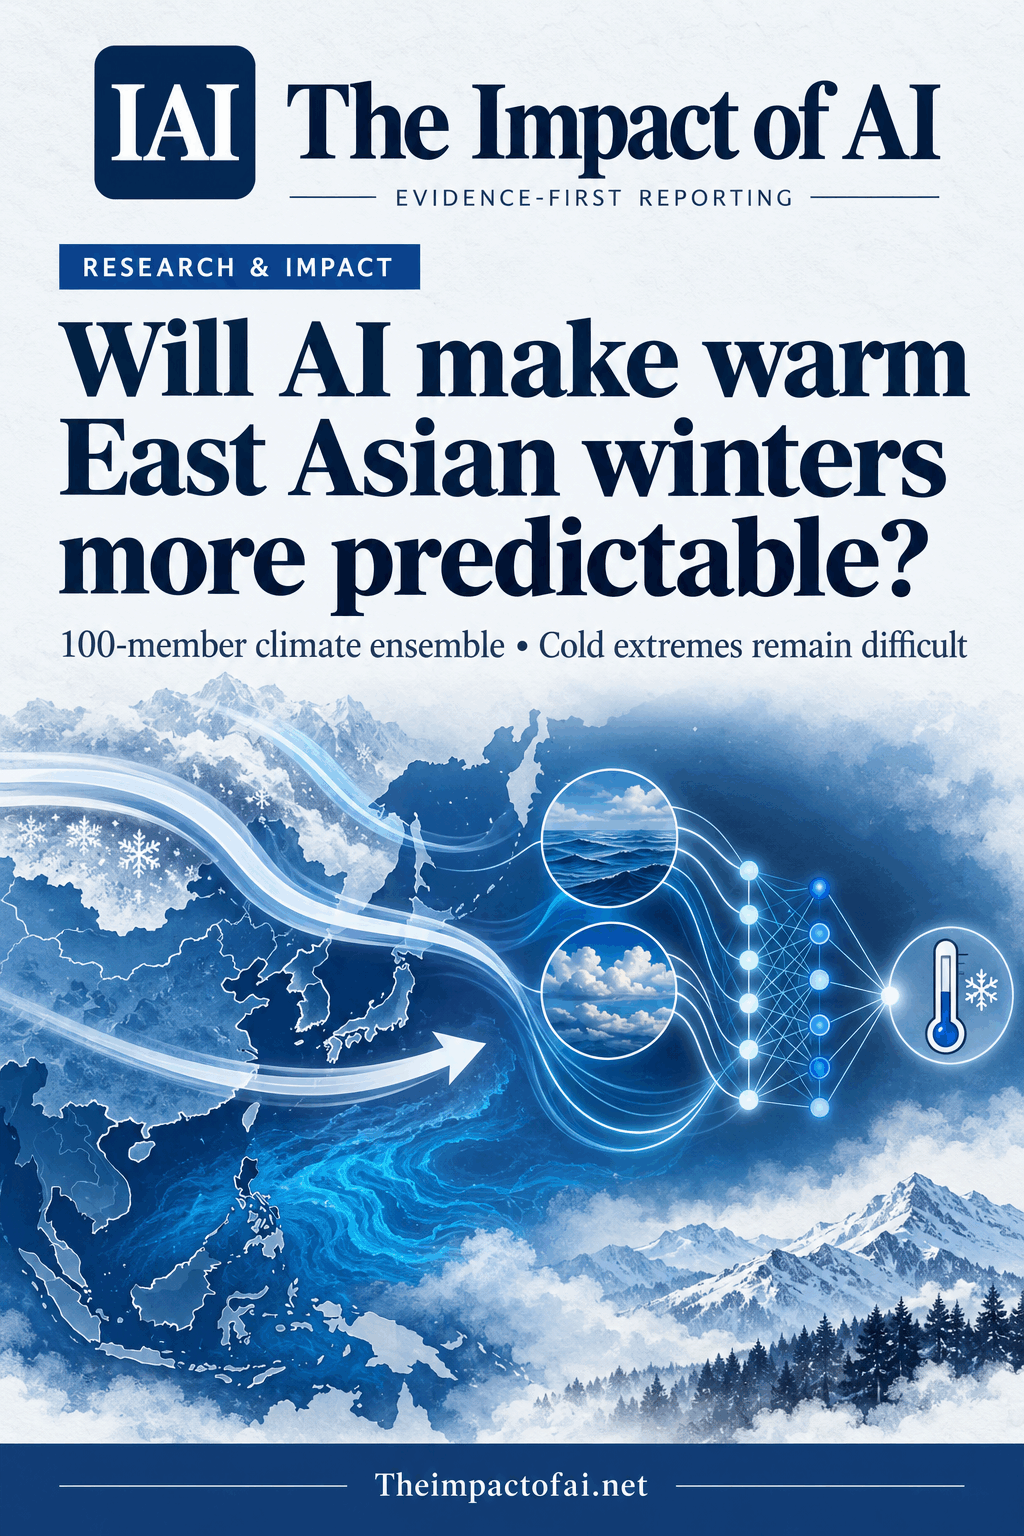
The model predicts a regional winter average from November conditions
The study asks whether the sources of seasonal predictability change as the climate warms. Its convolutional neural network takes global November maps of 14 atmospheric and ocean variables—including temperature, pressure, winds, snow cover, surface heat flux, sea-surface temperature and sea-surface height—and predicts the December-to-February mean surface-air temperature over East Asia between 30° and 50° north and 100° and 140° east.
That target is a broad regional seasonal average, not a city forecast or prediction of a specific cold snap. Seasonal means matter for heating demand, agriculture, transport and public-health planning, but they smooth short, damaging events. The architecture uses separate atmosphere and ocean branches before combining their features. An amplitude-focal loss gives larger temperature anomalies more influence during training, aiming to keep rare warm and cold winters from being overwhelmed by ordinary years.[1]
The Impact Brief · Free
Follow the evidence in climate & energy.
Get a five-minute weekday briefing on what changed, why it matters and where the evidence comes from. Choose the topics you care about.
The training denominator is large because it comes from a model ensemble
The core data came from CESM2-LENS, which contains 100 realizations from 1850 to 2100 under historical and SSP3-7.0 forcing. The authors compared the last 50 winters in each period: 1963/64 to 2013/14 and 2050/51 to 2099/2100. For each climate, 90 ensemble members supplied 4,500 training samples, while five members supplied 250 validation samples and five different members supplied 250 held-out test samples.
The team trained 100 independently initialized copies of the same network for each climate. This retraining ensemble estimates sensitivity to stochastic model training; it is not another 100 climate realizations. Inputs and targets were expressed as standardized anomalies, and each scenario's ensemble mean was removed year by year. That design prevents the rising long-term mean from automatically making future predictions look skilful, but it also means results concern relative warm and cold winters within each climate state.[1][2]
Mean skill improved slightly; warm extremes changed more
On held-out CESM2-LENS members, median correlation between predicted and simulated East Asian winter temperature was about 0.38 for the historical climate and 0.44 for SSP3-7.0. Median root-mean-square error fell from about 1.16°C to 1.06°C. Averaging the 100 retrained networks produced correlations of 0.41 and 0.46 and errors of 1.09°C and 0.96°C. These are modest improvements, not near-perfect forecasts.
The more distinctive result concerned extremes. The authors defined warm and cold categories using each scenario's normalized temperature percentiles and evaluated them with the Heidke skill score, where zero is no better than random. Cold-winter skill remained below roughly 0.2 for the coldest 15% and weakened at the five-percent tail. Warm-extreme skill was higher in the future at every tested threshold; for the warmest five percent it approached 0.3. Removing the amplitude-focal loss brought both warm and cold extreme skill close to zero.[1]
The observational check is encouraging but short
To connect the model experiment with the real climate, the authors fine-tuned 100 pretrained networks on 66 years of ERA5 reanalysis from 1958 to 2023. They used leave-one-year-out cross-validation, with 64 years for fine-tuning, one for validation and one for testing in each iteration. The resulting ensemble-mean correlation was about 0.5, compared with about 0.4 for a 20-member CESM2 physics-based seasonal forecast system over the overlapping historical evaluation.
Sixty-six winters are still a small observational denominator for rare extremes. Adjacent winters also showed modest short-lag autocorrelation, which the authors acknowledge may slightly inflate the leave-one-out estimate because the method assumes independent samples. The observational exercise evaluates mean winter temperature and adaptation to reanalysis. It does not reproduce the paper's future warm-versus-cold extreme comparison, which necessarily comes from model simulations.[1]
Explainability points to the tropical Pacific, not a proven cause
Integrated gradients assigned large prediction importance to tropical Pacific sea-surface temperature, western North Pacific heat flux and Eurasian snow cover. In the future simulation, the network's warm-winter predictions became more sensitive to positive tropical Pacific temperature anomalies, consistent with a stronger warm-phase pathway into East Asian circulation. Composite circulation analysis offered a physically plausible match: warm tropical conditions produced stronger extratropical responses under the warmer background state.
Integrated gradients describe how this trained network's output responds along a path from a baseline input. They do not establish causation, and taking absolute values can remove direction and the method's completeness property. The threshold used to highlight spatial importance was selected after sensitivity testing to suppress widespread weak signals. The explanation is therefore a useful diagnostic supported by climate dynamics, not proof that the network discovered the only mechanism or that operational forecasts will improve for the same reason.[1]
What would change the assessment
Confidence would increase if independent groups reproduced the result with other large ensembles, forcing scenarios, reanalyses and forecast systems. Testing spatially detailed temperatures, heating-degree days, snowfall and short extreme events would connect the seasonal mean to decisions people actually make. Predeclared comparisons should quantify whether the focal loss improves rare-event calibration and false-alarm rates, not only categorical skill.
The decisive evidence would be prospective out-of-sample seasonal forecasts issued before winter and evaluated over many years, with uncertainty ranges and baselines from operational centres. A warmer climate may make some warm states more predictable within one model while structural errors in tropical Pacific trends work in the opposite direction. For now, the study provides a carefully designed hypothesis: warm East Asian winter extremes may become somewhat easier for this class of model to anticipate, while cold extremes remain stubbornly difficult.[1][3]
What this means for people
- Better seasonal guidance could help energy planners, farmers, transport operators and public-health teams prepare for unusually warm winters.
- Cold extremes remain difficult in this experiment, so a warming average should not be treated as protection from dangerous cold seasons.
- A regional seasonal prediction cannot tell an individual community when a particular disruptive event will occur.
Global context
The work was led by South Korean institutions and focuses on East Asia, but its larger question is global: climate change can alter not only weather distributions but also the signals that make seasons predictable. Because tropical Pacific trends are a major source of disagreement between observations and coupled models, reproducing the result outside CESM2 is essential before other regions or services rely on the same conclusion.
What the evidence does not yet show
- The historical-versus-future comparison is a perfect-model experiment within CESM2-LENS rather than an evaluation of real future forecasts.
- SSP3-7.0 is one high-emissions pathway; predictability changes may differ under other scenarios and climate models.
- The target is a broad East Asian December-to-February mean, not local temperature, snowfall, heating demand or individual cold spells.
- Only 66 observational winters were available for transfer learning, and short-lag autocorrelation may modestly inflate leave-one-out skill.
- Integrated gradients reveal model sensitivity, not causal climate mechanisms; absolute attribution and thresholding require judgment.
- Rare-event Heidke scores remained modest even where future warm-extreme performance improved.
What to watch next
- Replication across multiple climate models, reanalyses, emissions pathways and operational forecast systems.
- Prospective forecasts issued before winter and scored for calibration, misses and false alarms.
- Whether gains persist for local extremes, snowfall, heating demand and short cold events.
- Physical experiments testing the proposed tropical-Pacific sensitivity pathway independently of the neural network.
Living evidence record
Impact record IAI-17BCZH2
Evidence stage
Studied
Confidence
Supported
Reporting basis
Source analysis
Independent or research support
Present
Record status
Monitoring
Last checked
5 October 2026
Source trail
3 direct sources across 1 source type.
People impact
Documented in this record.
Uncertainty
Limits and next checks are explicit.
Stages describe the evidence available—not whether a technology is good or bad. See the public method.
Related-source reporting disclosure
This record analyses 3 linked source records around the same underlying development. The extra records add method, date or context, but they do not by themselves constitute independent replication of every performance claim or predicted outcome.
Evidence trail
Sources used for this report
Links checked 5 October 2026
This report is labelled source analysis. We summarise and analyse source material in our own words; company statements remain attributed claims until independently supported. Translated summaries preserve the meaning of the original source and link back to it. Read our editorial standards.
Continue the story
Related reporting
Climate & Energy
Is AI good or bad for the climate?
A new BIS paper concludes that the net effect remains uncertain: AI may improve grids, forecasting and climate innovation while increasing electricity, water and material demand. The report synthesises evidence and scenarios; it does not calculate a global net emissions balance.
9 min · 2 sources
Climate & Energy
Can AI really forecast India’s air quality this accurately?
A peer-reviewed model reported an R² of 0.9994 on 435,742 historical records, but the target was a three-pollutant AQI proxy dominated by one of its inputs, severe episodes were scarce and the data ended in 2015. The result is promising method work, not evidence that today’s official AQI can be forecast almost perfectly.
8 min · 1 source
Climate & Energy
Can AI agents find water leaks?
A peer-reviewed system coordinated hydraulic simulation, network partitioning, sensor placement and graph-based detection across five water networks. Its strongest result came from simulated leaks equal to 20% of total demand—not a live utility trial or proof that a language model found a physical leak.
8 min · 3 sources
Reader commentary
Add evidence, experience or a question
No account is required. Reader notes are published after a brief civility, relevance and safety check; disagreement is welcome.
Explore commentary across the portal →Published reader notes
0No published reader notes yet. You can start the evidence-led discussion above.
Prefer a private correction or response? Contact the newsroom.