Can AI forecasts make a microgrid cheaper and cleaner?
Not on the evidence in this study. A peer-reviewed model found a grid-connected solar-and-battery design cheapest under its assumptions and hybrid neural networks forecast one building's net load, but the forecasts never controlled dispatch and the paper's renewable-fraction figures do not reconcile.
Editorial responsibility: The Impact of AI Editorial Desk · Report a factual concern
At a glance
- 1Under the paper's assumed prices and 25-year horizon, grid-connected solar plus two 1 MWh batteries had the lowest modeled net present cost: $65.5 million, compared with $78.9 million for the grid-and-diesel option and $240 million for the islanded diesel option.
- 2Six forecasting architectures used hourly weather data and one campus building's load, an 80:20 split, a 48-hour lookback and a one-hour forecast horizon; TCN-GRU reported the lowest net-load MAE at 14.088.
- 3The forecasting outputs were never fed into HOMER Pro or a live controller, so the paper does not measure savings, battery cycling, grid imports or emissions caused by AI-guided dispatch.
Research topic
Whether separately modeled deep-learning forecasts and HOMER Pro planning results establish operational savings or emissions benefits for a campus microgrid
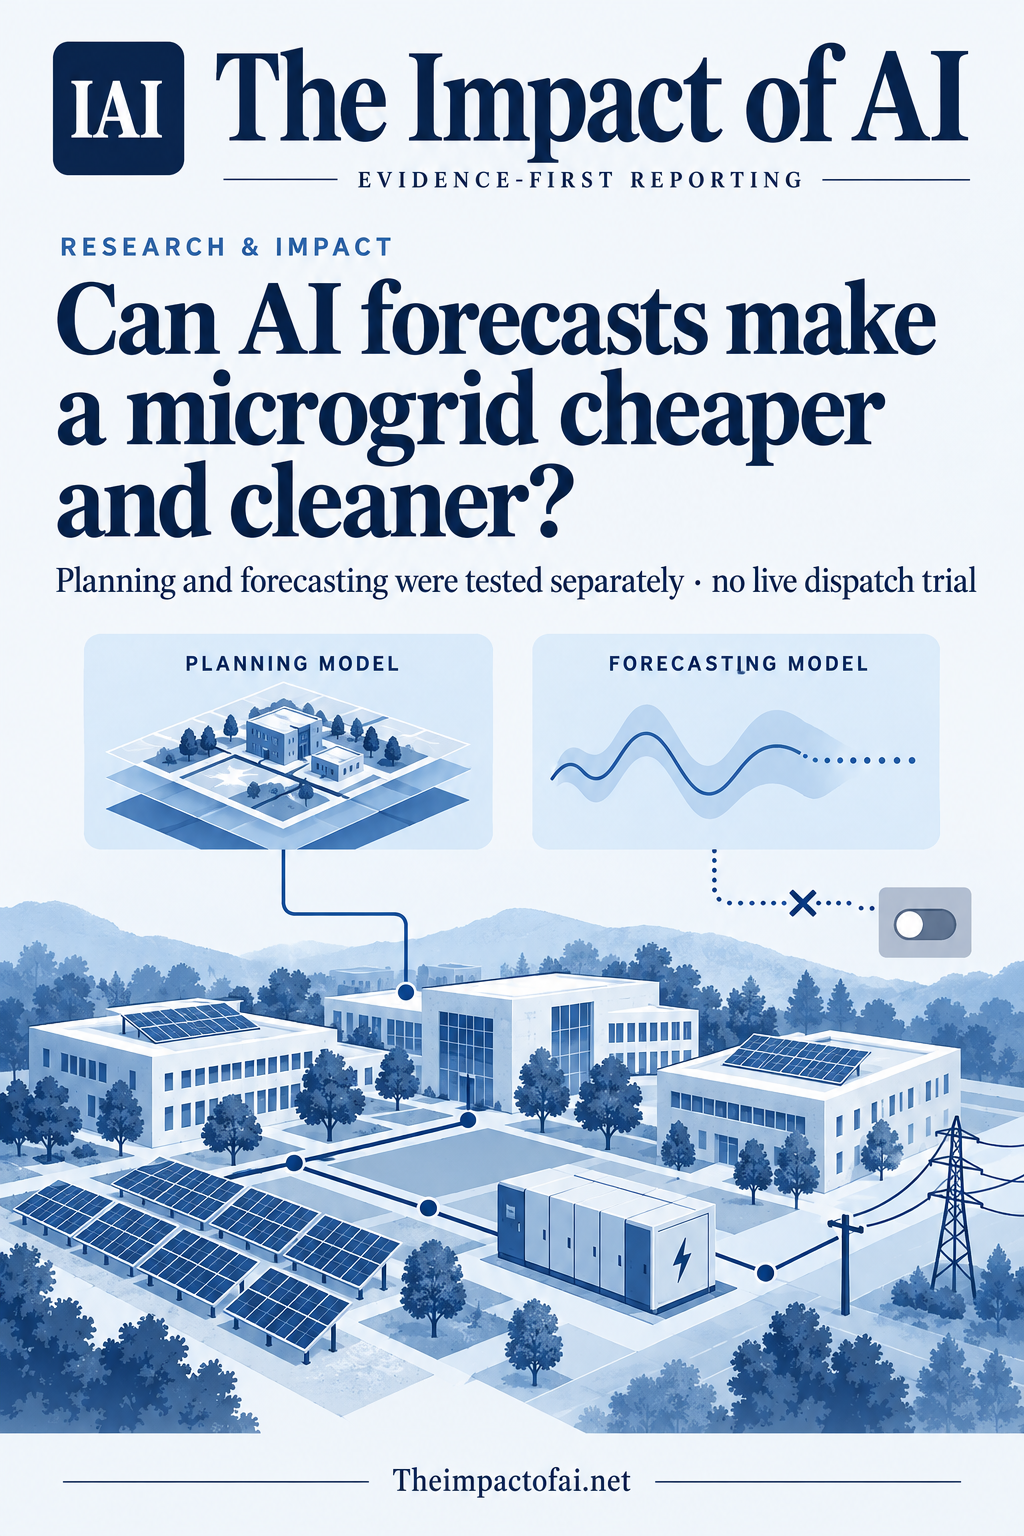
The answer is not yet: the study joins two separate exercises
A Scientific Reports paper published on 6 October combines a long-term microgrid planning model with one-hour-ahead deep-learning forecasts. The planning result is concrete within the authors' assumptions: a grid-connected solar-and-battery configuration had the lowest modeled lifetime cost. The forecasting experiment also reports comparatively low errors on one university building. But the two stages remained sequential. Forecasts were not passed into the HOMER Pro dispatch engine, a model-predictive controller or a working energy-management system.
That separation changes the answer to the reader's question. The paper shows that a conventional optimizer can rank three hypothetical architectures and that neural networks can predict weather-linked load in a held-out portion of one dataset. It does not show that using those predictions made a microgrid cheaper, reduced emissions, shifted battery charging or improved resilience. The authors acknowledge that direct quantitative evaluation of forecast-aware dispatch was outside the study because of software-integration limits.[1]
The Impact Brief · Free
Follow the evidence in climate & energy.
Get a five-minute weekday briefing on what changed, why it matters and where the evidence comes from. Choose the topics you care about.
The planning model favoured grid support, not a cleanest system
The HOMER Pro exercise modeled a North Texas campus load of 90,000 kWh per day over 8,760 hourly intervals. It compared solar PV and battery storage paired with diesel generation; the same components plus the utility grid; and solar plus batteries and the grid without diesel. Assumptions included a 25-year project life, a 6% real discount rate, grid electricity at $0.10 per kWh, diesel at $1 per litre, PV capital cost of $1,000 per kW and a fixed grid-emissions factor of 386 grams of CO2 per kWh. Every configuration had to serve all modeled load.
Solar plus batteries and the grid produced the lowest modeled net present cost, $65.5 million, and the lowest levelized cost, about $0.105 per kWh. Adding diesel and grid access raised those values to $78.9 million and $0.127 per kWh. The islanded solar-battery-diesel option reached $240 million and $0.386 per kWh because the optimizer selected 70 one-megawatt-hour battery units and much more PV and conversion capacity to maintain supply without the grid.
Cheapest did not mean lowest-carbon. The grid-connected cases imported about 47.9 million kWh a year and were assigned roughly 18.5 million kilograms of CO2 annually. The islanded case was assigned about 5.32 million kilograms because its oversized PV system supplied more energy and reduced diesel use. The study therefore exposes a policy choice built into the objective: minimizing lifecycle cost under a fixed tariff and emissions factor favoured heavy grid reliance, while the renewable-heavy design cost far more. Different tariffs, carbon intensity, reliability requirements or carbon constraints could change the ranking.[1]
The forecasting test uses one building and estimated solar output
The forecasting stage used public University of Texas at Dallas weather and load datasets sampled hourly. Weather inputs included irradiance, temperature, humidity, wind speed and solar angle. Although the load collection contains 13 campus buildings, the authors chose Building B4 as the only load target. They merged it with weather by timestamp, removed missing or inconsistent records, applied min-max scaling and encoded hour, weekday and month cyclically.
Six architectures were compared: LSTM, LSTM-GRU, LSTM-XGBoost, LSTM-LightGBM, TCN and TCN-GRU. Each used a 48-hour lookback to predict one hour ahead, with 80% of the sequence for training and 20% for testing. The methods table also refers to three sliding-window folds, while the experimental overview calls the validation a static window. The paper does not report the calendar period or final number of usable hourly observations after exclusions, leaving the training and test denominators unclear.
For building load, LSTM-XGBoost reported the lowest mean absolute error, 13.107 kW, with a 4.31% mean absolute percentage error. For derived net load, TCN-GRU reported the lowest MAE, 14.088, and RMSE, 19.596. The authors nevertheless recommended LSTM-GRU as a deployment compromise across accuracy, latency and model size. Those comparisons are useful as a benchmark, but the PV component was not measured. It was calculated from predicted irradiance using an estimated 1,950-square-metre panel area and assumed 20% efficiency, with the area approximated partly from Google Earth imagery.[1]
Several metrics need reconciliation before operational use
The strongest numerical warning is inside the techno-economic table. It lists the grid-connected systems' renewable fraction as 0.622%, while the discussion describes the same result as approximately 62%. Neither presentation obviously agrees with the table's annual PV production of about 898,918 kWh and total electricity production of 48.8 million kWh, a simple ratio near 1.8%. The paper does not reconcile the three figures. The difference is too large to treat as rounding because renewable fraction is central to whether a design is presented as clean.
The forecasting metrics also require careful interpretation. GHI mean absolute percentage errors ranged from about 53.5% to 79.8%, while the paper's separately defined 'accuracy' values exceeded 95%. Percentage errors become unstable when irradiance is near zero, but reporting both measures without a clearer explanation can give conflicting impressions. The stated 95% intervals around net-load MAE assume normally distributed residuals; the study did not present a full probabilistic uncertainty analysis.
The authors report three runs with different random seeds and say paired t-tests found hybrid models better than baselines at p<0.05. The paper does not provide the individual test statistics, exact p-values or a correction for the many model-and-task comparisons. Public code and data links help reproducibility, but an independent reanalysis should establish the exact split, sample count, leakage controls and whether the ranking holds across time periods and sites.[1]
What this means for campuses and energy users
For a campus, hospital or industrial site, one-hour forecasts could be valuable if they allow batteries to charge before a peak, reserve energy for an outage, reduce costly imports or avoid unnecessary generator starts. Those actions affect bills, local pollution and service continuity. A forecast with low average error is only an input, however. The user-facing benefit depends on the controller, tariff, storage limits, reserve rules, forecast uncertainty and penalties for a wrong decision.
The planning result is also site-specific. North Texas solar conditions, the assumed grid price and emissions factor, and a 90,000-kWh daily campus load do not transfer automatically to India, Europe, Africa or another US grid. The authors are at Vellore Institute of Technology in Chennai, India, but the modeled resources and load data are American. The paper reports no external funding and no competing interests.
The practical lesson is modest but useful: planners should keep forecasting performance, dispatch benefit, financial optimization and decarbonization as separate claims. A system can forecast accurately without saving money; it can minimize costs while increasing assigned emissions; and it can look optimal only because tariffs or component sizes were fixed in a favorable way. Procurement decisions need the linked chain of evidence, not one model score.[1]
What would change the assessment
The decisive next study would connect forecasts to a controller and compare it prospectively with a non-AI schedule under the same load, weather and tariff. It should report grid imports, peak demand, battery cycling and degradation, renewable curtailment, outage performance, generator runtime, operating cost and emissions. A simulation can provide the first comparison, but hardware-in-the-loop and live multi-building trials would show whether latency, missing data and forecast misses alter the result.
Confidence in the current benchmark would rise if the authors published the observation dates, final sample counts, fixed train-validation-test boundaries, all test statistics and corrected renewable-fraction values. Measured PV output should replace the area-and-efficiency estimate. External replication across buildings and climates should compare point forecasts with simple persistence and probabilistic baselines, then propagate forecast uncertainty into dispatch decisions.
Until that evidence arrives, the study is best read as two building blocks: a cost-focused HOMER planning exercise and a single-site forecasting benchmark. It does not yet establish that AI made a microgrid cheaper, cleaner or more reliable in operation.[1]
What this means for people
- Campus and public-service operators could eventually use reliable short-term forecasts to reduce peaks and prepare storage, but this paper does not measure those savings.
- A least-cost design can carry higher modeled emissions, so tariff savings should not be presented to communities as automatic decarbonization.
- Decision-makers need linked evidence from forecast to controller to operational outcome before paying for an AI energy-management claim.
Global context
The authors are based in Chennai, India, while the public weather and building-load data and modeled solar resource come from the University of Texas at Dallas. The framework could be retrained and re-parameterized elsewhere, but electricity prices, grid carbon intensity, climate, building schedules, outage risks and battery economics vary substantially. The study is therefore a transferable workflow proposal, not a globally validated cost or emissions estimate.
What the evidence does not yet show
- Forecasts were not incorporated into HOMER Pro dispatch, a closed-loop controller or a live microgrid, so no AI-caused operational benefit was measured.
- The forecasting evaluation uses load from one building at one US campus and does not state the calendar period or final number of hourly observations.
- PV output and net load depend on estimated panel area and assumed module efficiency rather than measured PV generation.
- The reported renewable fraction is internally inconsistent with both the narrative and the energy totals in the same table.
- Costs, tariffs, emissions factors and reliability constraints are modeled assumptions that may not transfer to other sites or years.
- Three random-seed runs and normal-residual intervals do not replace multi-site, temporal and operational validation.
What to watch next
- A corrected renewable-fraction table and a complete machine-readable result set.
- A fixed chronological split with dates, observation counts and leakage checks.
- Measured PV production and independent replication across multiple buildings and climates.
- Closed-loop comparison of forecast-informed dispatch with persistence and rule-based schedules.
- Real outcomes for bills, peak demand, battery degradation, grid imports, emissions and resilience.
Living evidence record
Impact record IAI-00HL8OE
Evidence stage
Studied
Confidence
Supported
Reporting basis
Source analysis
Independent or research support
Present
Record status
Monitoring
Last checked
6 October 2026
Source trail
1 direct source across 1 source type.
People impact
Documented in this record.
Uncertainty
Limits and next checks are explicit.
Stages describe the evidence available—not whether a technology is good or bad. See the public method.
Single-source reporting disclosure
This record analyses one direct source. It can establish what Scientific Reports published or reported, but it is not independent corroboration of every performance claim or predicted outcome. The confidence label will change only when broader evidence is added.
Evidence trail
Sources used for this report
Links checked 6 October 2026
This report is labelled source analysis. We summarise and analyse source material in our own words; company statements remain attributed claims until independently supported. Translated summaries preserve the meaning of the original source and link back to it. Read our editorial standards.
Continue the story
Related reporting
Climate & Energy
Can a hybrid model forecast clean energy further?
D-MambaFormer produced the lowest average error on three energy-related benchmarks while using a compact hybrid architecture. The improvements over the strongest alternatives were roughly 0.3% to 3%, and no live grid, dispatch decision or operating cost was tested.
9 min · 1 source
Climate & Energy
Can machine learning stabilise renewable microgrids in real time?
A peer-reviewed simulation study generated 3,000 solar, wind, temperature and load scenarios, then trained ensemble models to imitate an optimiser's controller settings. Gradient boosting reproduced those settings closely, but no physical microgrid or live disturbance was tested.
6 min · 2 sources
Climate & Energy
Can neurosymbolic AI make electricity grids safer?
A simulation study combined learned grid recommendations with hard topology checks and fuzzy control, cutting losses and outage energy on benchmark feeders—but no live network, operator or physical controller was tested.
7 min · 1 source
Reader commentary
Add evidence, experience or a question
No account is required. Reader notes are published after a brief civility, relevance and safety check; disagreement is welcome.
Explore commentary across the portal →Published reader notes
0No published reader notes yet. You can start the evidence-led discussion above.
Prefer a private correction or response? Contact the newsroom.